- Published on
Debugging a Slow DynamoDB Query
- Authors

- Name
- Pierce Bartine
Recently I was talking to a friend about a website that he's building. Without going into too much detail, his site consists of a Blazor frontend, an ASP.NET Core backend API, and AWS DynamoDB as the persistence layer. He mentioned to me that upon startup, the first few calls to one of his API endpoints ran unexpectedly slowly, which piqued my curiosity. We ended up going down the profiling rabbit hole and eventually figured it out.
TLDR: Establishing a TCP connection takes a while.
Background
Here's an excerpt from the API logs showing our slow calls:
API.Queries.GetItemInfoQuery: Finished in 670ms  # First request to the API after startup
API.Queries.GetItemInfoQuery: Finished in 180ms  # "Slow" requests
API.Queries.GetItemInfoQuery: Finished in 180ms  # "
API.Queries.GetItemInfoQuery: Finished in 93ms   # "Fast" requests
API.Queries.GetItemInfoQuery: Finished in 92ms   # "
API.Queries.GetItemInfoQuery: Finished in 92ms   # "
GetItemInfoQuery essentially retrieves a payload from DynamoDB using the QueryAsync method in the AWS SDK for .NET. Seeing this left us with a few questions:
- Why do the calls get faster?
- Why is the first call so slow? (we didn't end up investigating this)
Investigation #1: Profiling
See this post for a more in-depth look at generating flame graphs for .NET.
We decided to first create some flame graphs to profile the code. In hindsight this was a case of the streetlight anti-method, as I had recently been interested in flame graphs and stack traces after working with pprof to profile some Go programs. It was an interesting endeavor to do the same for a .NET program, but we didn't end up finding much out about this specific issue.
First, we modified the API's Dockerfile to be built in debug mode (ie, dotnet build -c Debug ...), and added the following environment variable to the Docker Compose file:
COMPlus_PerfMapEnabled=1
This allowed us to use the Linux profiling tool perf to generate a report that we could later process into a flame graph. After launching the container and execing into it, we ran the following command to gather profiling data:
# Install the necessary tooling (assumes a Debian environment)
apt update && apt install git linux-perf

# Start perf and observe PID 1 until a ctrl-c is sent
perf record -p 1 -g
In our case, the dotnet program was running as PID 1. While perf was running, we issued some API calls via curl to our service to try and reproduce the issue. Once the issue had been seen, we sent a ctrl-c event perf which caused it to stop and dump its report to a file in the current directory called perf.data.
We then ran the data file through Brendan Gregg's famed flame graph generation tool from within the running container:
# Clone the flame graph generator
git clone --depth=1 https://github.com/BrendanGregg/FlameGraph

# Generate an interactive SVG from the perf data
perf script | FlameGraph/stackcollapse-perf.pl | FlameGraph/flamegraph.pl > flamegraph.svg
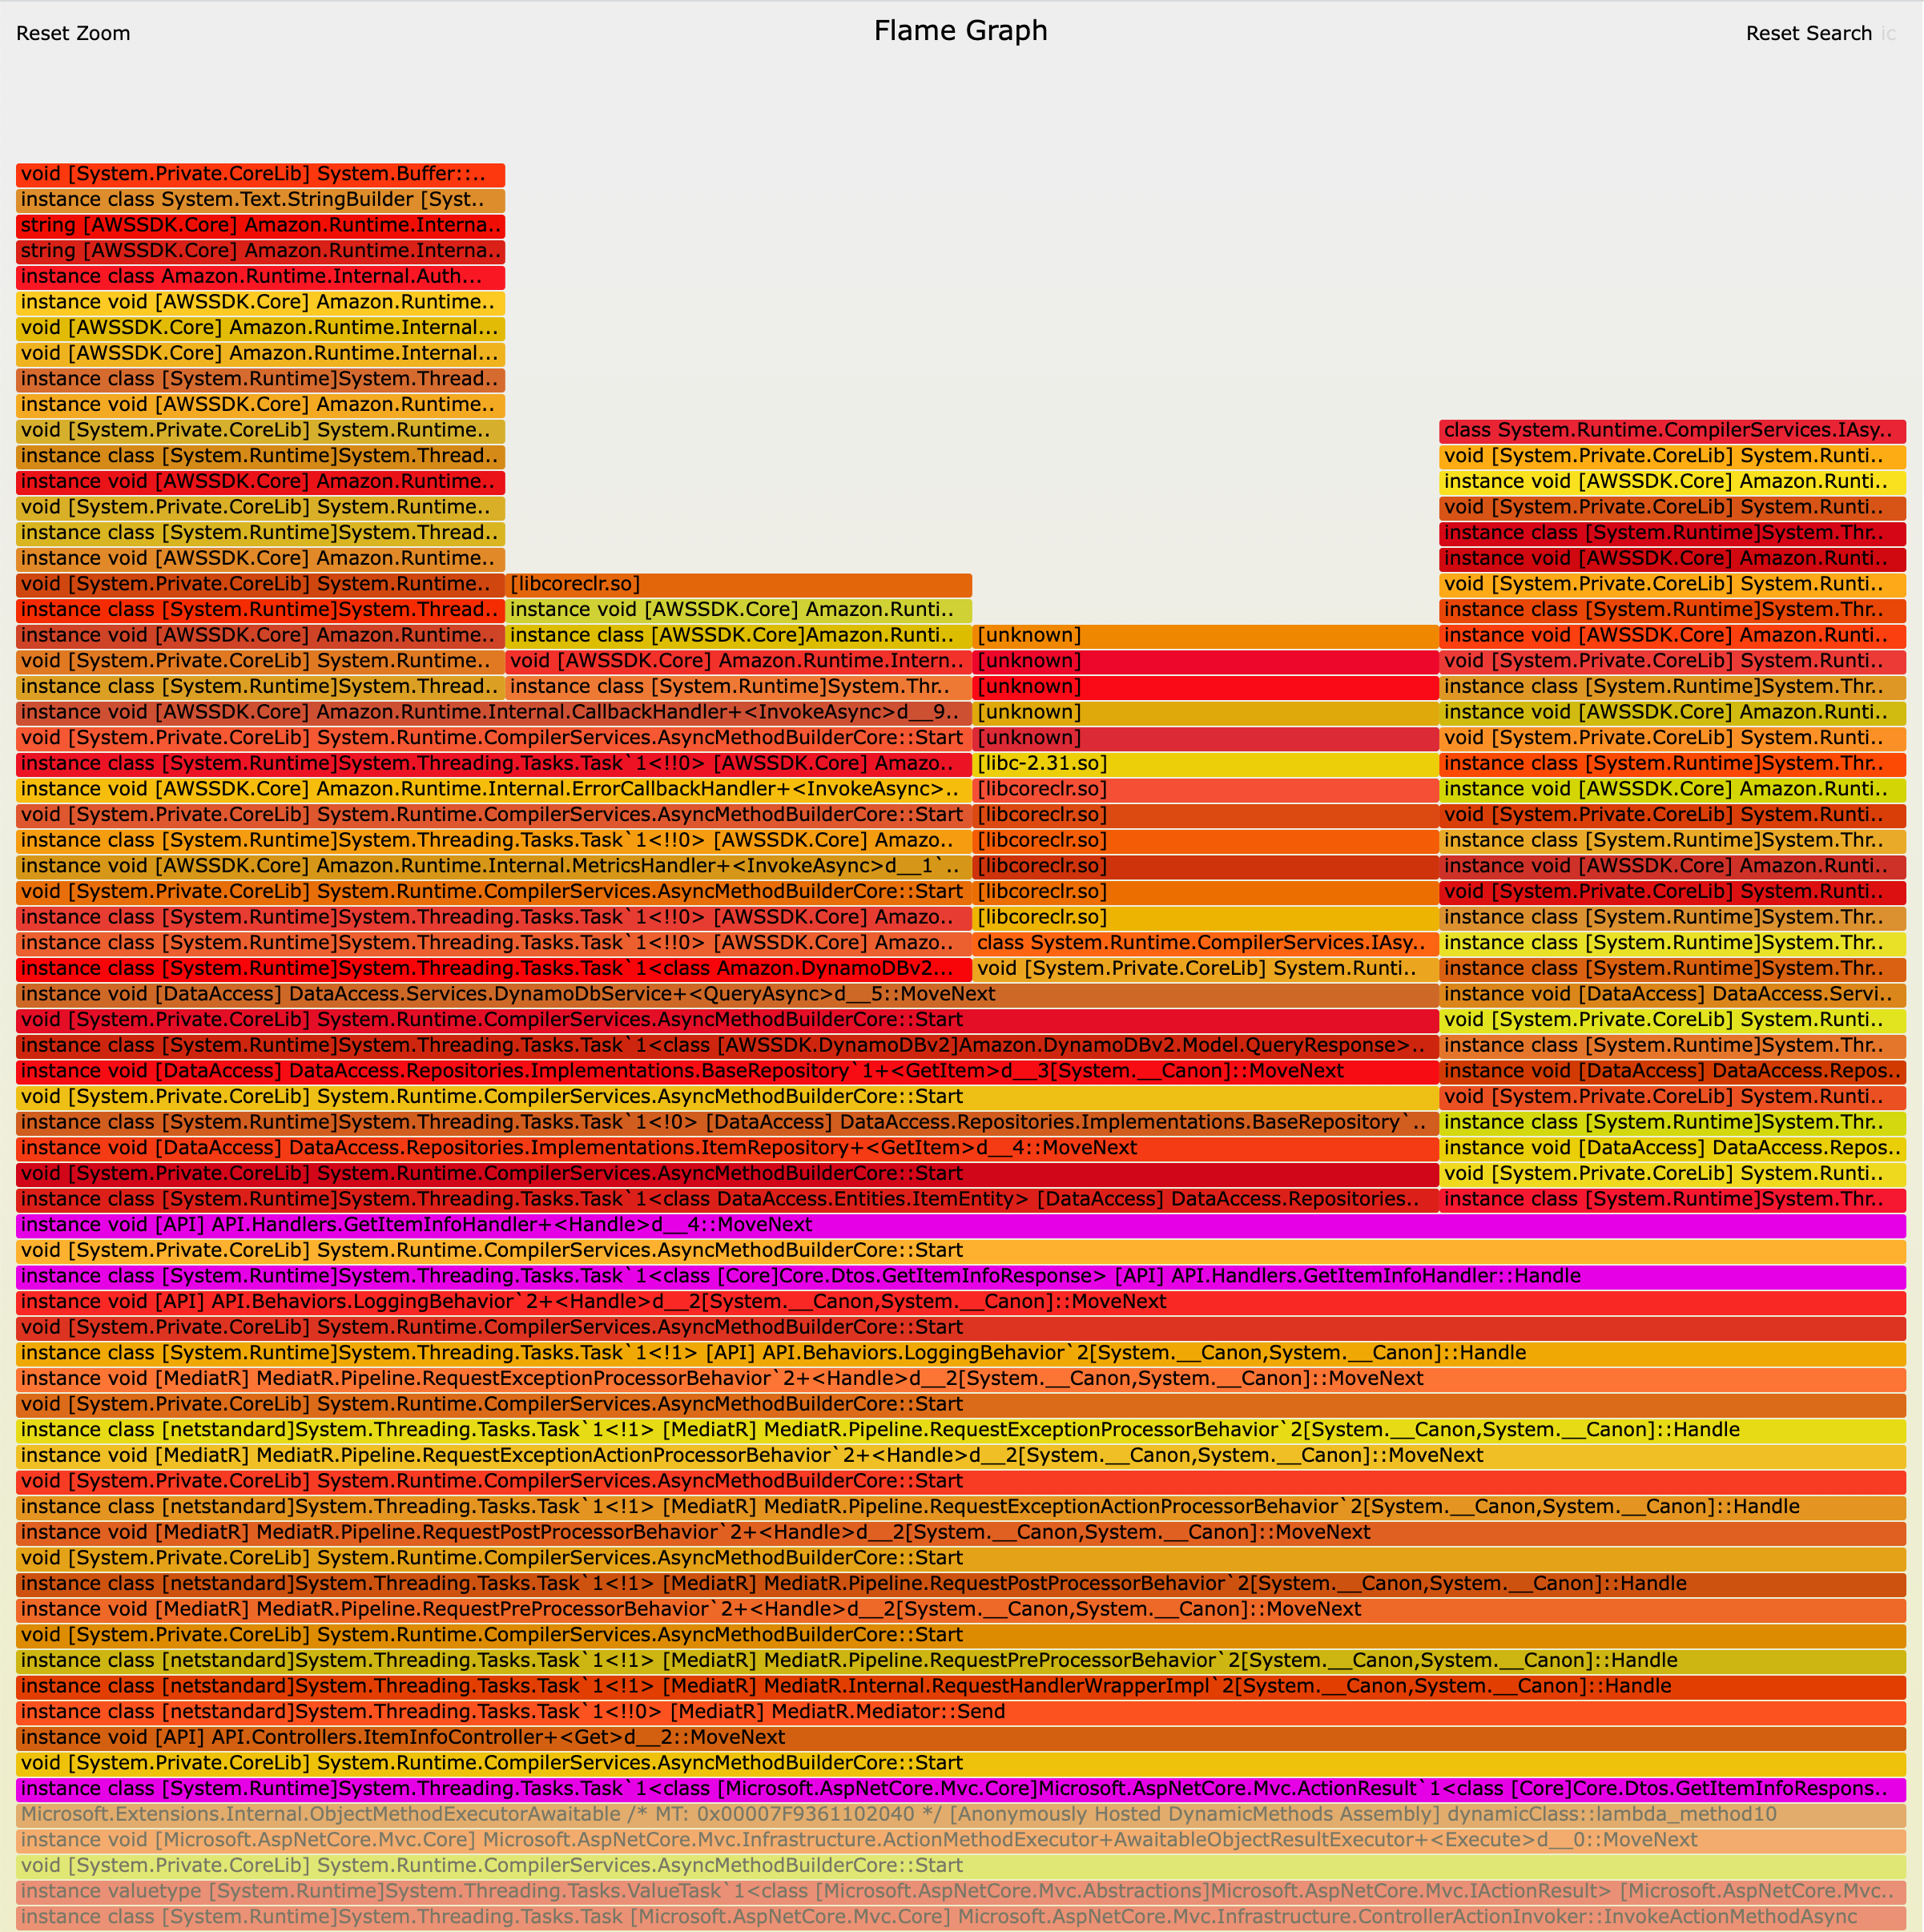
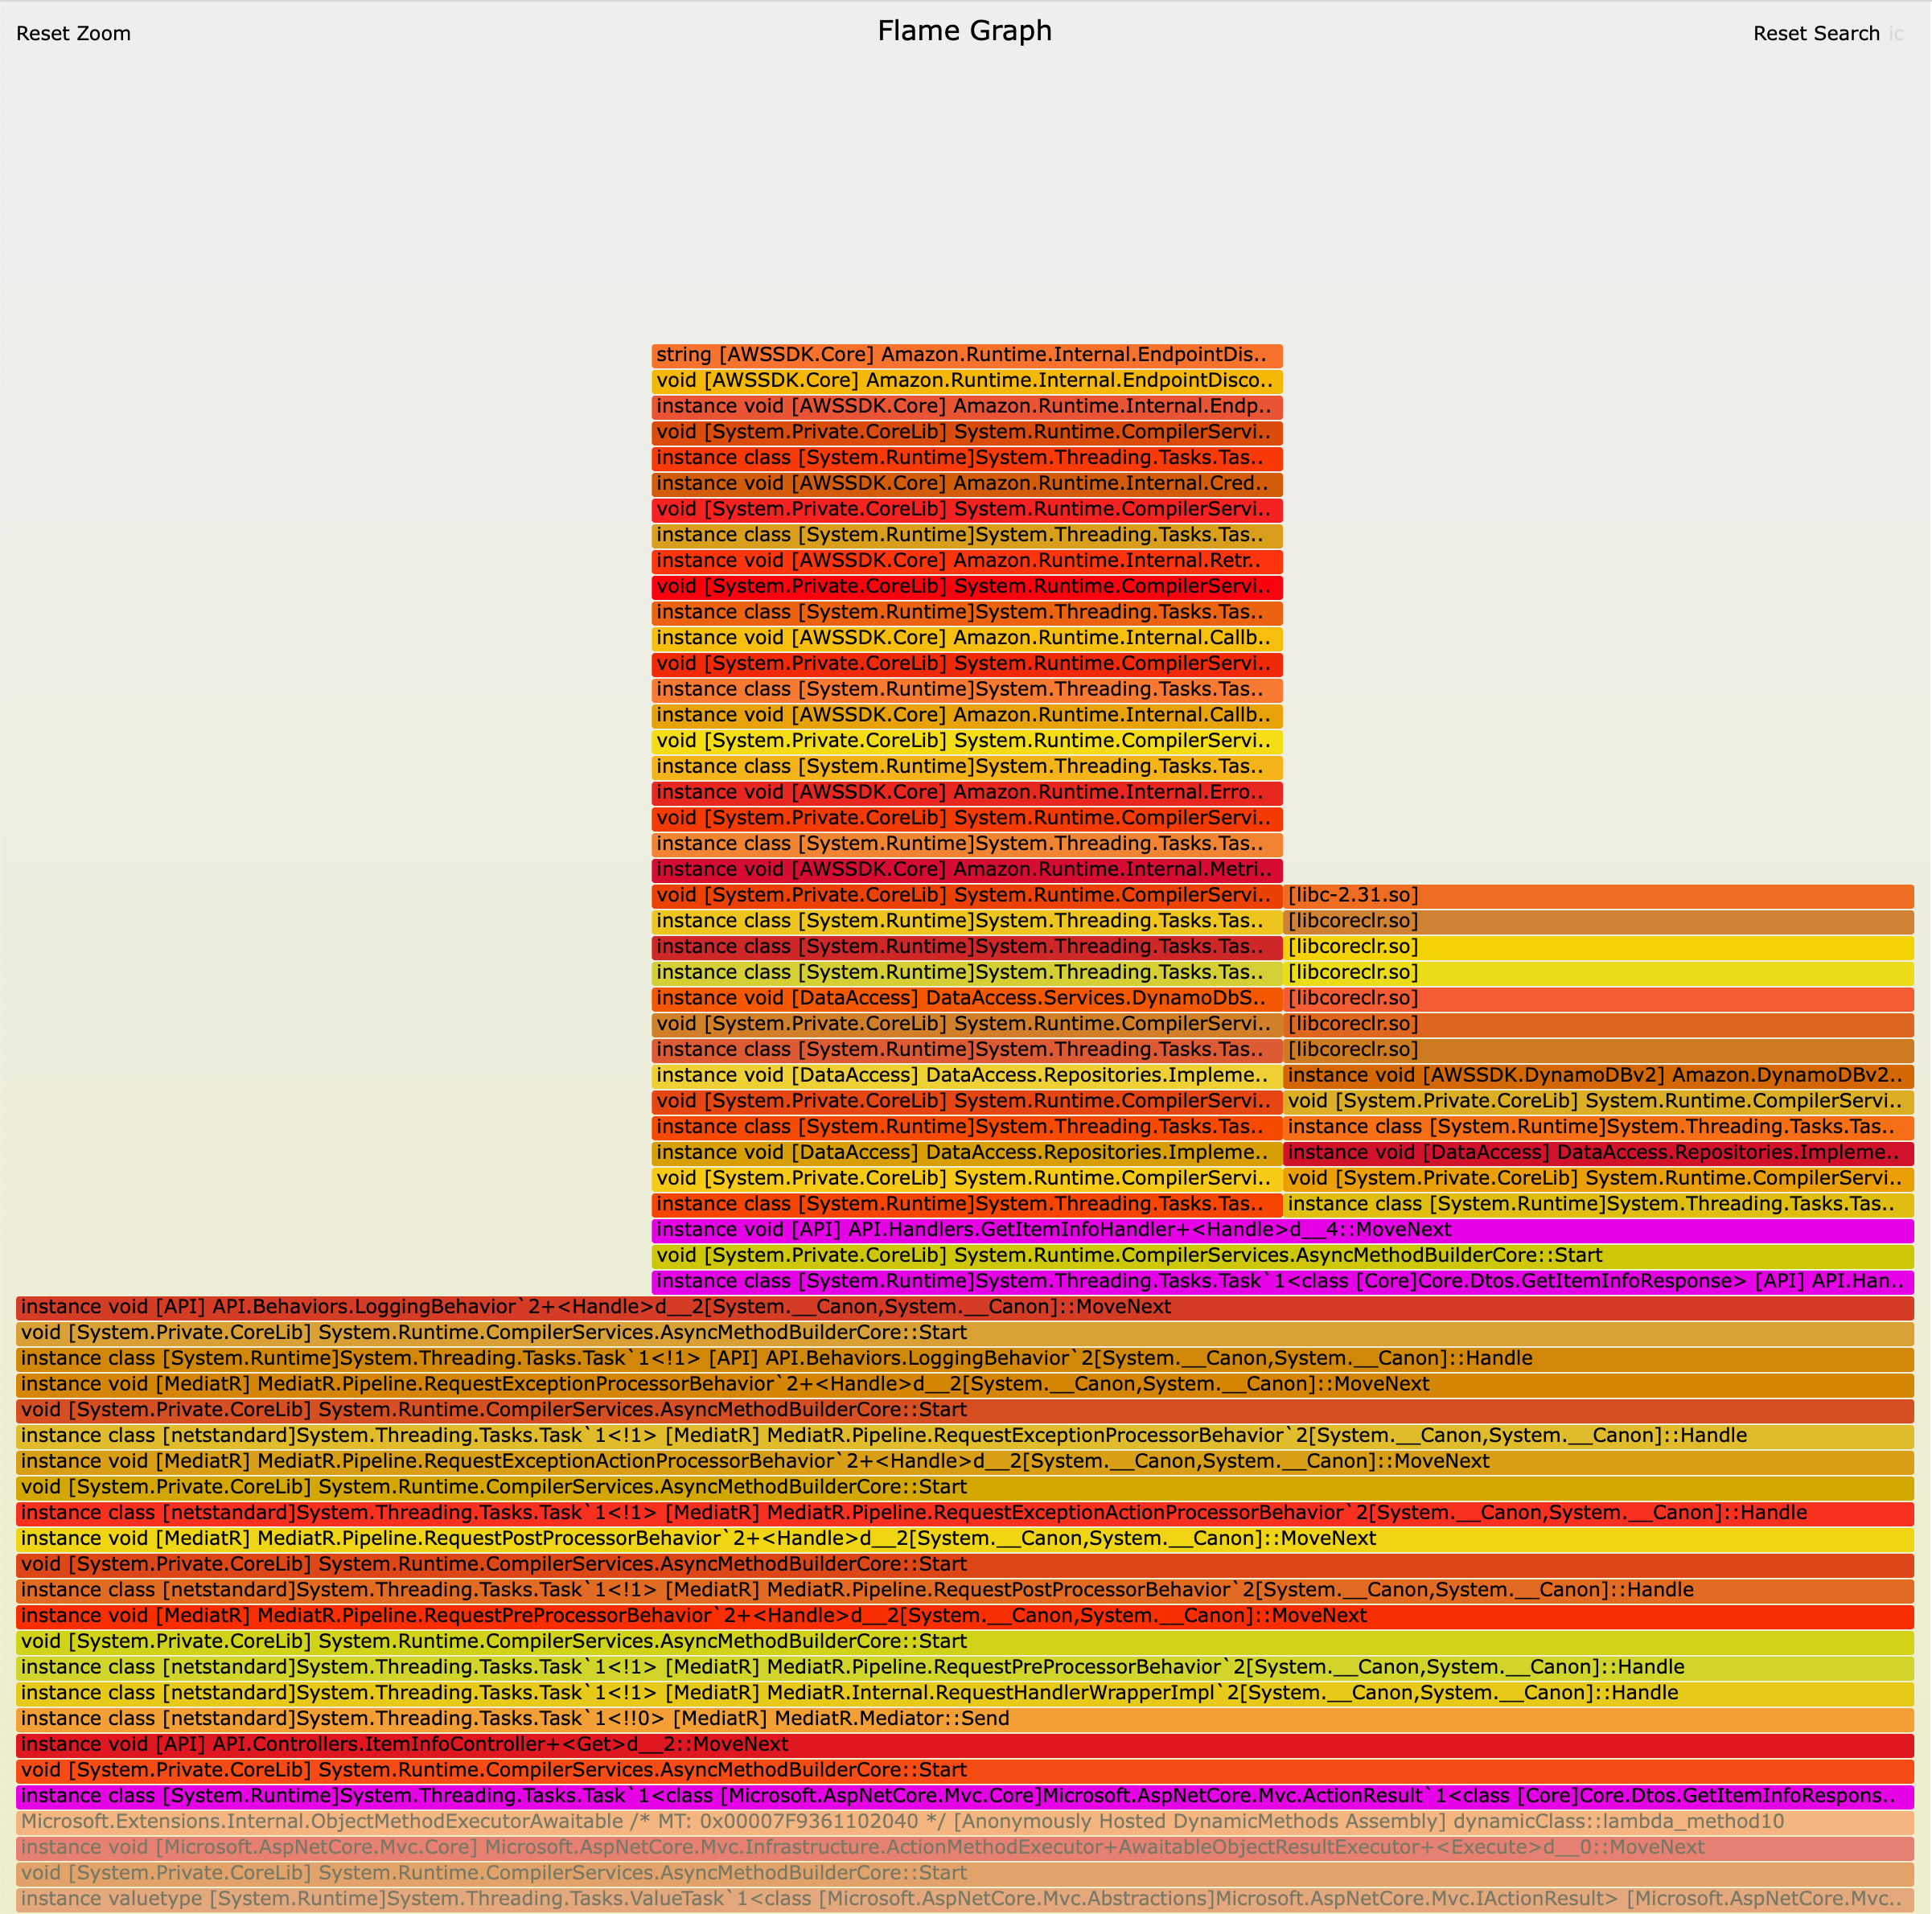
We ended up generating two flame graphs using this method - one for a single "slow" call, and one for a single "fast" call.
The full flame graphs are quite large. Scoped down to just a search for GetItemInfo, we got the following graphs:


While these graphs were definitely interesting, we weren't making much progress on finding out the root cause for our issue. We iced the flame graphs for the time being.
Investigation #2: Tracing
See this post for a more in-depth look at using OpenTelemetry and Jaegar with .NET.
We switched gears and started putting stopwatches in the code to hone in on where the slowness was coming from. Eventually we modified the code to include an OpenTelemetry tracing agent that sends to a local instance of Jaegar.
Program.cs:
// *SNIP* imports...
using OpenTelemetry;
using OpenTelemetry.Resources;
using OpenTelemetry.Trace;

var builder: WebApplication.CreateBuilder(args);

// *SNIP* adding controllers, MediatR, etc...

builder.Services.AddOpenTelemetryTracing((builder) =>
{
  builder.AddAspNetCoreInstrumentation()
    .AddHttpClientInstrumentation()
    .SetResourceBuilder(ResourceBuilder.CreateDefault().AddService("API"))
    .AddJaegerExporter(opts =>
    {
      opts.AgentHost: "localhost"; // FIXME hardcode
      opts.AgentPort: Convert.ToInt32(6831); // FIXME hardcode
      opts.ExportProcessorType: ExportProcessorType.Simple;
    });
});

// *SNIP* the rest of Program.cs...
After reproducing the issue again using curl, we got the following traces:

First call to GetItemInfo after startup.
This trace shows significant latency both before and after making a request to DynamoDB. We did not investigate further into this initial call as it's amortized. Pinning down the exact source of the initial call's latency could be an interesting future investigation.


In both the slow and fast calls, we noticed that that virtually all of the latency occurs due to DynamoDB requests. In other words, the DynamoDB requests themselves are getting faster. We could not see what was happening in each of these DynamoDB calls, so we disabled TLS temporarily (this is purely a development instance by the way):
appsettings.json:
{
  "AWS": {
    "UseHttp": true
  }
}
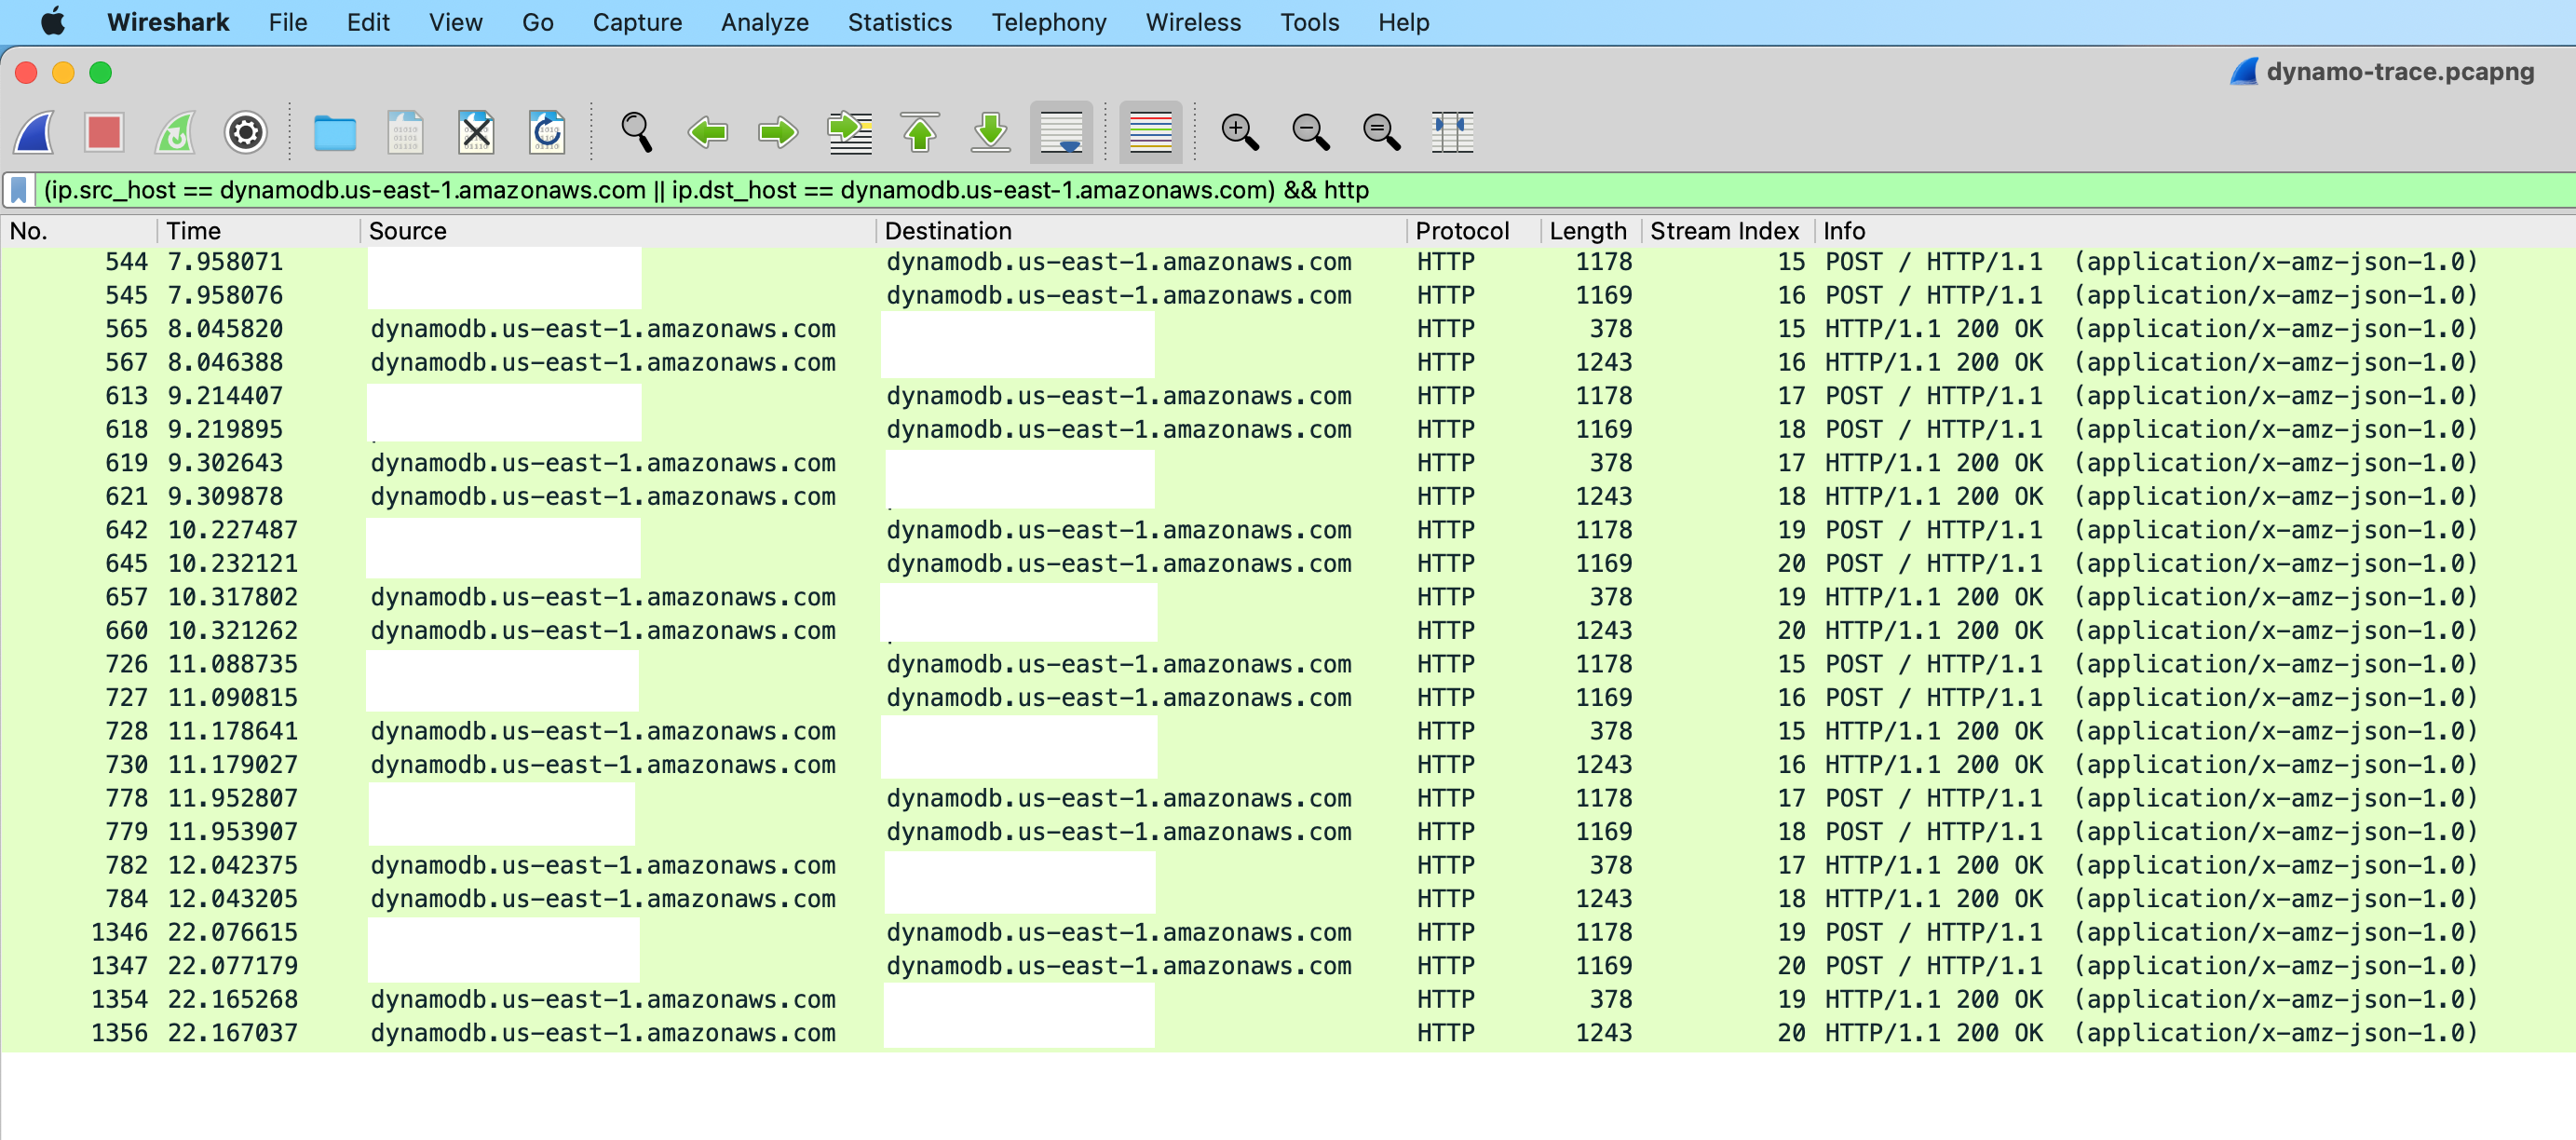
We then busted out Wireshark to snoop on the traffic and reproduced the issue again via curl. Here is a view of the sequence of HTTP calls that correspond to the logs in the beginning of this post:

If we zoom in on only TCP stream index 15 and open up the query a bit to show all TCP packets (minus keepalives), we see the smoking gun.

When there are no existing TCP connections with DynamoDB, the AWS SDK needs to first establish one. If there are existing TCP connections, they can just be reused. When TCP connection establishment is taken into account, the DynmaoDB HTTP round trip times for the slow and fast calls match up perfectly with the timings we saw in our logs and traces. Root cause identified!
Conclusion
Making a TCP connection with DynamoDB takes around ~100 ms, at least for this app at this point in time. This cost is paid on the first few calls to DynamoDB until the AWS SDK has a pool of open connections that are alive and ready to go. If no traffic happens on any of these connections for a while, they'll be torn down and the next call will again pay the cost of establishing a TCP connection.
Additionally, at this time DynamoDB does not support HTTP/2. Many (most?) other AWS services do support HTTP/2. If it did, this behavior may be mitigated to some degree, as HTTP/2 can multiplex requests over a single TCP connection.
All in all, if a service is seeing continuous load this whole issue should be virtually unnoticeable. It was an interesting investigation nonetheless, and could be applicable to some systems that see infrequent but latency-sensitive requests.